The Wyckoff Method, developed by Richard D. Wyckoff in the early 20th century, is a sophisticated technical analysis tool used by traders to identify market trends and make informed trading decisions. Initially applied to the stock market, its principles are highly relevant to the Forex market as well. The method centers around understanding the forces of supply and demand through price and volume analysis, offering traders a systematic approach to market behavior.
Applying Wyckoff Principles to Forex Trading
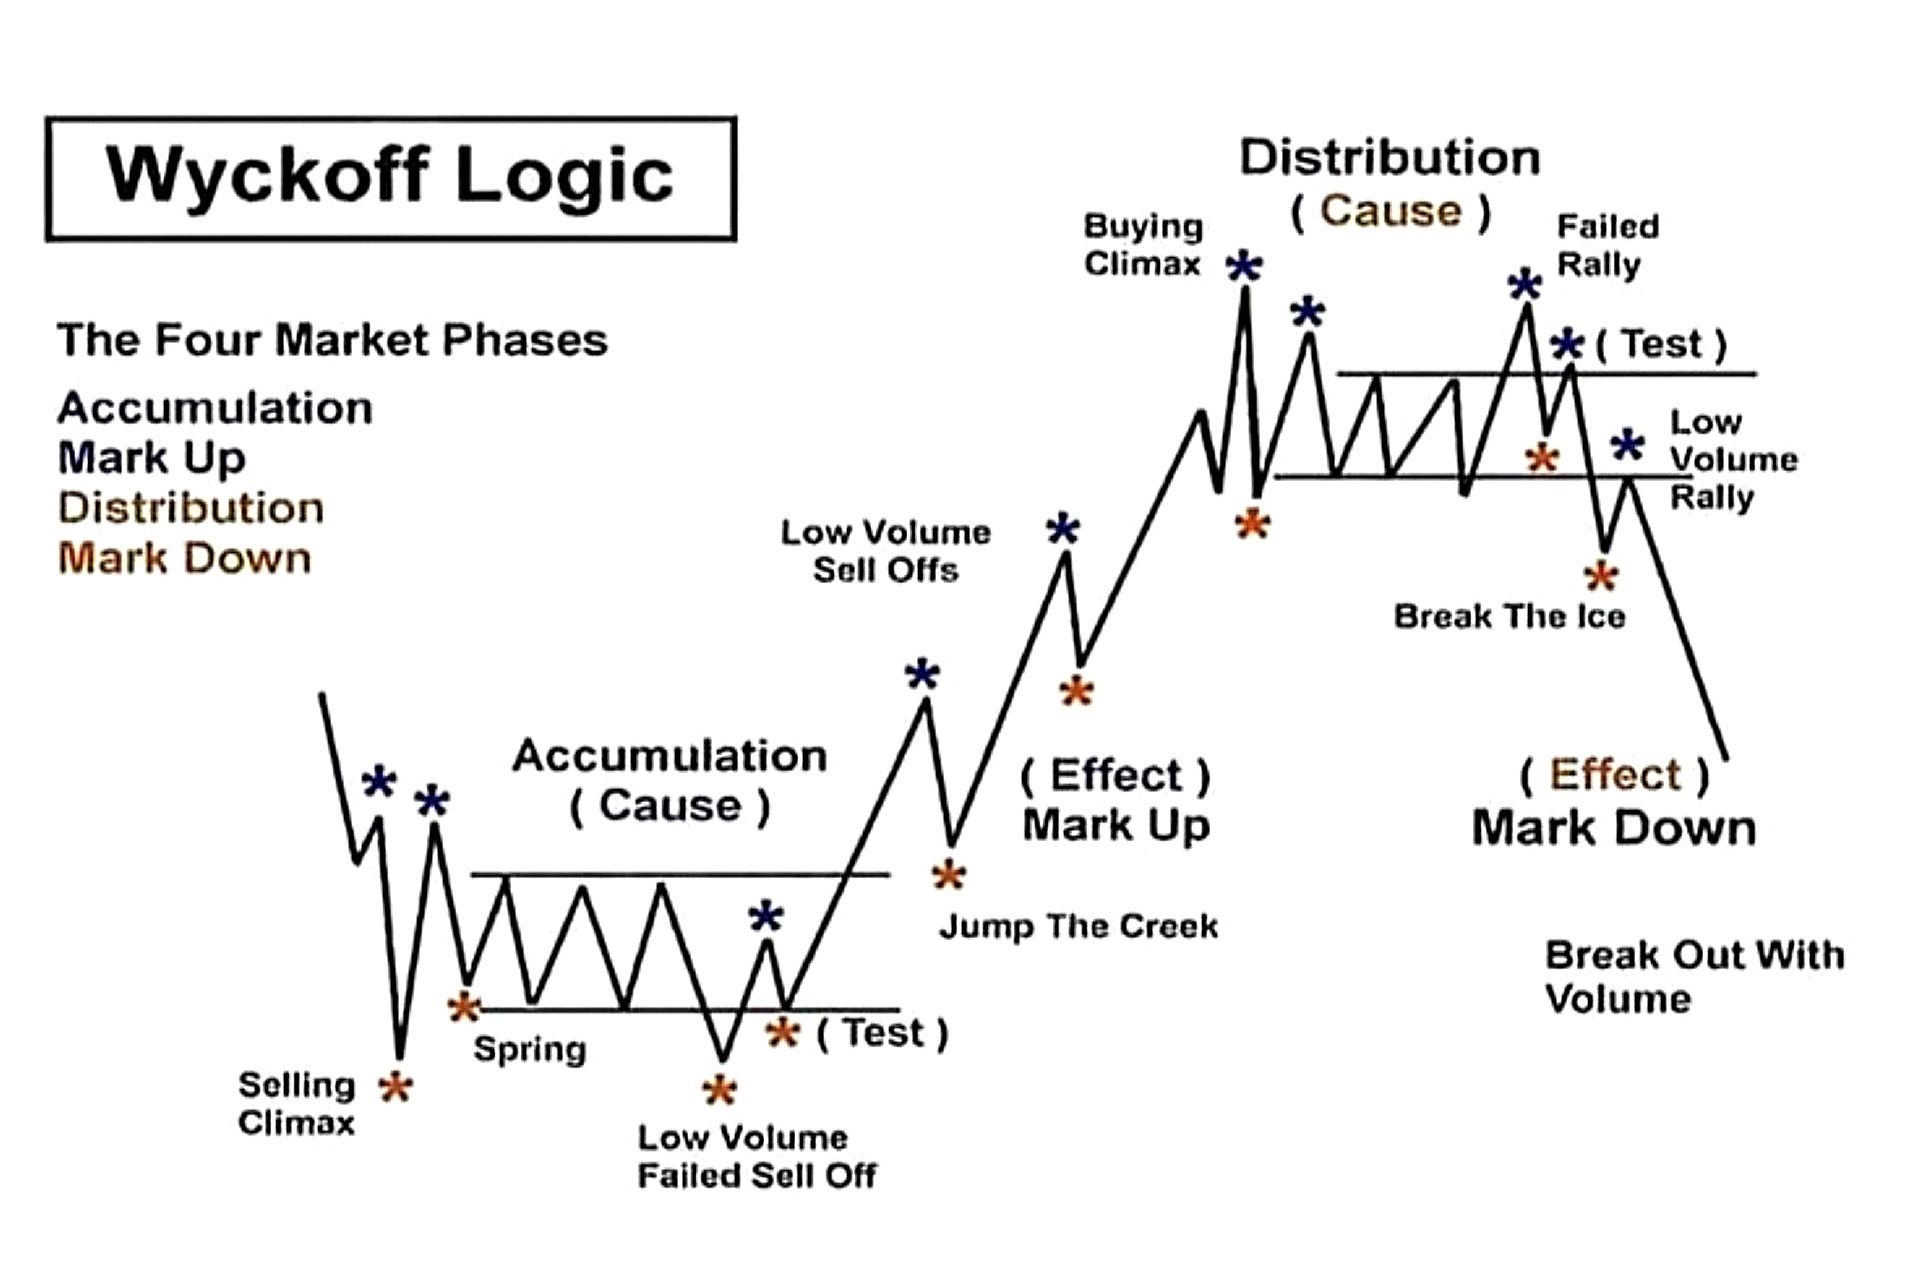
Applying the Wyckoff Method to Forex trading involves several steps, each requiring careful analysis and interpretation. The first step is to identify the current market phase, which can be done by observing price and volume patterns. In the accumulation phase, for example, traders look for signs of strong buying activity, such as increased volume on up days and decreased volume on down days. This indicates that large players are quietly accumulating positions.
Once the market phase is identified, traders can use Wyckoff’s three laws—supply and demand, effort versus result, and cause and effect—to guide their trading decisions. The law of supply and demand, the most fundamental principle, states that prices rise when demand exceeds supply and fall when supply exceeds demand. In Forex trading, this can be observed by analyzing volume indicators in conjunction with price movements to identify potential trading opportunities.
The law of effort versus result suggests that significant price movements should be accompanied by corresponding volume changes. If a price movement occurs on low volume, it may indicate a lack of conviction and a potential reversal. Conversely, a strong price move on high volume suggests a genuine shift in market sentiment. Applying this law to Forex trading can help traders distinguish between true breakouts and false signals, improving their entry and exit timing.
The law of cause and effect helps traders estimate the potential magnitude of a price move based on the preceding accumulation or distribution phase. By measuring the duration and intensity of these phases, traders can set realistic price targets and manage their risk more effectively. In Forex trading, this approach allows for more precise forecasting of currency pair movements, enhancing the overall trading strategy.
Practical Implementation: Case Study and Example
To illustrate the practical application of the Wyckoff Method in Forex trading, consider a case study involving the EUR/USD currency pair. Suppose the pair has been trading in a range for several weeks, with noticeable accumulation signals such as increased volume on up days and decreasing volume on down days. According to the Wyckoff Method, this indicates a potential accumulation phase.
Traders would then look for a breakout above the range, accompanied by a significant increase in volume, signaling the start of the markup phase. By entering a long position at this point, traders can capitalize on the upward trend. During the markup phase, the Wyckoff Method suggests monitoring volume patterns to confirm the strength of the trend and adjust positions accordingly.
A table summarizing the key observations during this case study could look like this:
| Phase | Price Action | Volume Pattern | Trading Strategy |
| Accumulation | Trading range, low volatility | Increased on up days | Prepare for potential long |
| Markup | Breakout above range | Significant increase | Enter long position |
| Distribution | Price stalls, forms a range | Decreased on up days | Prepare to exit long |
| Markdown | Breakdown below range | Increased on down days | Enter short position |
In the distribution phase, traders observe signs of reduced buying interest, such as lower volume on up days and higher volume on down days. This indicates that the upward trend is losing momentum and a potential reversal is imminent. Traders should then prepare to exit their long positions and potentially enter short positions as the market transitions into the markdown phase.
Challenges and Considerations
When integrating the Wyckoff Method into Forex trading, traders must be aware of several challenges and considerations to effectively apply this method. Below is a detailed list that expands on these critical points:
- Complexity of Analysis: Identifying the correct market phase requires a deep understanding of price and volume patterns. Misinterpretation can lead to premature entries or exits.
- Experience Requirement: Successfully distinguishing between accumulation, markup, distribution, and markdown phases necessitates experience and practice.
- False Signals: Forex markets are prone to false breakouts and whipsaws, which can mislead traders into believing a phase transition has occurred.
- Geopolitical Events: Currency markets are highly sensitive to geopolitical events, such as elections, wars, and trade negotiations, which can cause sudden and unpredictable price movements.
- Economic Data Releases: Important economic indicators (e.g., GDP, employment reports, interest rate decisions) can significantly impact currency prices and may not align with Wyckoff’s principles.
- Central Bank Policies: Actions and statements from central banks (e.g., the Federal Reserve, European Central Bank) can lead to rapid market shifts that challenge technical analysis.
- Rapid Trend Changes: Forex markets are characterized by their high volatility and rapid trend changes, requiring traders to be adaptable and quick in adjusting their strategies.
- Pattern Evolution: Market patterns can evolve quickly, making it difficult to rely on static analysis methods. Traders need to continuously update their analysis.
- 24-Hour Market: The Forex market operates 24/5, adding to the complexity as traders need to monitor positions continuously or use automated systems to manage trades.
Understanding and addressing these challenges is essential for successfully integrating the Wyckoff Method into Forex trading. By being aware of these considerations, traders can better prepare and adapt their strategies to the dynamic and often unpredictable nature of the Forex market.
Advanced Techniques and Tools
Beyond the foundational principles, advanced techniques and tools within the Wyckoff Method can further refine a trader’s approach to the Forex market. One such technique is the use of Point and Figure (P&F) charts, which Wyckoff himself utilized extensively. Unlike traditional bar or candlestick charts, P&F charts focus solely on price movements, filtering out minor fluctuations and providing a clearer view of significant trends and patterns.
P&F charts can be particularly useful in identifying accumulation and distribution phases with greater precision. By tracking the number of price reversals needed to form a column, traders can pinpoint key support and resistance levels. In the Forex market, where quick and sharp movements are common, P&F charts can help traders stay focused on the broader trend without being distracted by short-term volatility.
Another advanced tool is the Composite Man concept, a theoretical market participant representing the collective actions of the largest and most influential traders. By analyzing the market through the lens of the Composite Man, traders can gain insights into the likely actions of institutional players. This perspective is invaluable in the Forex market, where large institutions often drive major price movements.
The integration of volume spread analysis (VSA) with the Wyckoff Method can also enhance trading strategies. VSA examines the relationship between price movements, volume, and the spread of price bars to identify market strengths and weaknesses. By combining VSA with Wyckoff’s principles, traders can obtain a more nuanced understanding of market conditions, improving their ability to anticipate price changes.
Comparative Analysis: Wyckoff vs. Other Methods
While the Wyckoff Method offers a comprehensive approach to market analysis, it’s beneficial to compare it with other popular trading methods to understand its unique advantages. For instance, let’s compare the Wyckoff Method with the Elliott Wave Theory and the Fibonacci Retracement approach.
| Aspect | Wyckoff Method | Elliott Wave Theory | Fibonacci Retracement |
| Core Principle | Market cycles, supply and demand | Wave patterns in price movements | Retracement levels based on ratios |
| Key Focus | Price and volume analysis | Identifying wave counts and patterns | Identifying support/resistance |
| Market Phases | Accumulation, markup, distribution, markdown | Impulse waves and corrective waves | Retracement levels within trends |
| Application Complexity | Moderate to high | High | Moderate |
| Flexibility | Adaptable to various markets and timeframes | Requires precise wave counting | Useful for identifying pullbacks |
The Wyckoff Method’s focus on market phases and volume patterns offers a more flexible and adaptable approach compared to the Elliott Wave Theory, which requires precise wave counting and can be complex to apply. The Fibonacci Retracement method, while simpler, lacks the depth of analysis provided by Wyckoff’s principles, particularly in understanding market psychology and the actions of major players.
Real-World Application: Forex Pair Analysis
To demonstrate the practical application of these advanced techniques, let’s analyze the GBP/USD currency pair using the Wyckoff Method. Suppose we observe that the pair has been in a consolidation phase, with price movements confined within a well-defined range. A closer examination using P&F charts reveals that the price has been forming a series of higher lows, indicating potential accumulation.
Traders would then look for signs of a breakout, such as an increase in volume and a decisive move above the resistance level. Using VSA, traders can confirm the strength of this breakout by analyzing the spread of the price bars and the accompanying volume. If the breakout is accompanied by wide spreads and high volume, it signals strong buying interest and the start of a markup phase.
During the markup phase, the Composite Man concept suggests that institutional players are likely accumulating positions. Traders can use this insight to maintain their long positions and ride the trend. Monitoring volume patterns and P&F charts helps traders stay aligned with the broader market trend and make timely adjustments to their positions.
In the distribution phase, P&F charts and VSA can again be used to identify signs of weakening demand. For instance, a series of lower highs on the P&F chart, coupled with high volume on down days, indicates that institutional players are starting to sell off their positions. This signals the potential start of a markdown phase, prompting traders to exit long positions and consider short positions.